Wired Assurance: Day 2 - Wired Health Metrics

See your LAN performance at a glance.
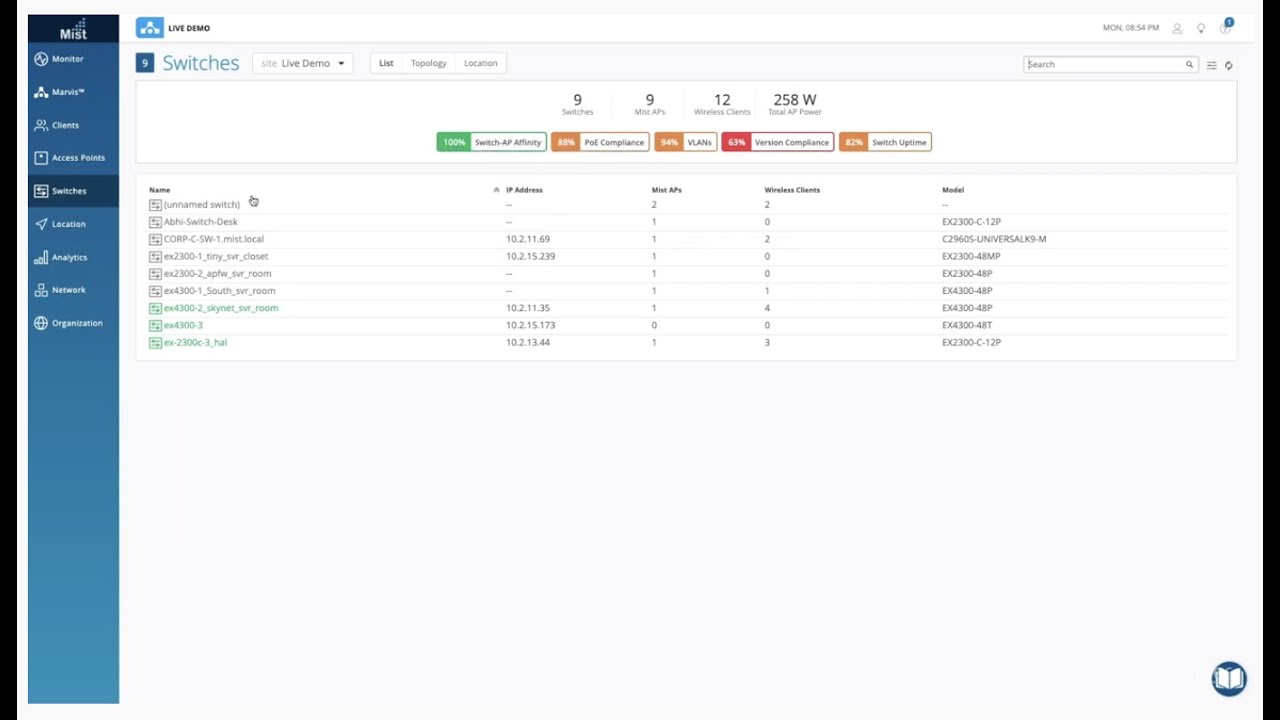
Understand how your LAN is performing with key health metrics such as switch-AP affinity, firmware compliance, PoE compliance, and more—all accessed within the Switches tab. Watch this Wired Assurance Day 2 demo to see how.
You’ll learn
Getting visibility into your LAN’s key health metrics
Viewing device inventory in a list, topology, or location view
Tracking performance for non-Juniper devices
Who is this for?
Transcript
0:00 [Music]
0:06 the switches tab is where you can get
0:08 all the wired health metrics
0:10 switches in gray are being discovered
0:12 while green indicates that the switch is
0:14 online and fully managed by the juniper
0:16 mist cloud
0:18 the metrics at the top provide a high
0:20 level sense of how the switches below
0:22 are doing
0:23 non-juniper switches are still accounted
0:25 for and can get wired visibility via
0:27 lldp by connecting a juniper access
0:30 point and marvis
0:34 these health metrics include switch ap
0:36 affinity
0:37 meaning do you have too many aps
0:39 connected to a switch
0:40 poe compliance are the aps getting
0:43 enough power
0:46 other metrics shown include vlans
0:49 version compliance and switch uptime
0:52 aside from the list view you can also
0:53 choose to see the switches in a topology
0:55 or location view
0:57 the topology view is an interactive way
0:59 to see all your switches
1:01 and the aps connected to them
1:09 the location view shows a map of where
1:11 all the switches are located
1:15 whether you have juniper ex's or
1:17 third-party platforms
1:18 wired assurance delivers the wired
1:20 visibility and health metrics to give
1:22 you a good pulse on how the network is
1:24 doing


